Difference between revisions of "Usage Data and Statistics"
(→Numbers of Annual Users: typo year) |
|||
| (12 intermediate revisions by 3 users not shown) | |||
| Line 1: | Line 1: | ||
| − | === |
+ | ===Numbers of Annual Users=== |
| − | The UCSB Nanofabrication Facility has seen large user base growth extending from 1998 to the present. A decrease was seen from 2013-2015 which was primarily a result of reduced academic government funding stemming from sequestration. Since 2015, growth in both academic and industrial sectors has been observed with |
+ | The UCSB Nanofabrication Facility has seen large user base growth extending from 1998 to the present. A decrease was seen from 2013-2015 which was primarily a result of reduced academic government funding stemming from sequestration. Since 2015, growth in both academic and industrial sectors has been observed with 2019 reaching the highest levels to date. Covid-19 deeply affected the 2020 use, but has since rebounded. The facility serves a broad range of disciplines with Optics, Electronics, Materials, MEMs, and Physics all being over 12% of use. 2018 data is shown as an example and this remains a consistent representation. |
| − | [[File:Yearly Users by Affiliation Through 2018.png| |
+ | [[File:Yearly Users by Affiliation Through 2018.png|800x800px|Number of lab hours per year from 1998-2021 by affiliation|none|thumb]] |
[[File:2018 User Chart by Discipline.png|frame|Percentages of Users by User-Reported Research Discipline for 2018|none]] |
[[File:2018 User Chart by Discipline.png|frame|Percentages of Users by User-Reported Research Discipline for 2018|none]] |
||
| − | === |
+ | ===External Use of Facility=== |
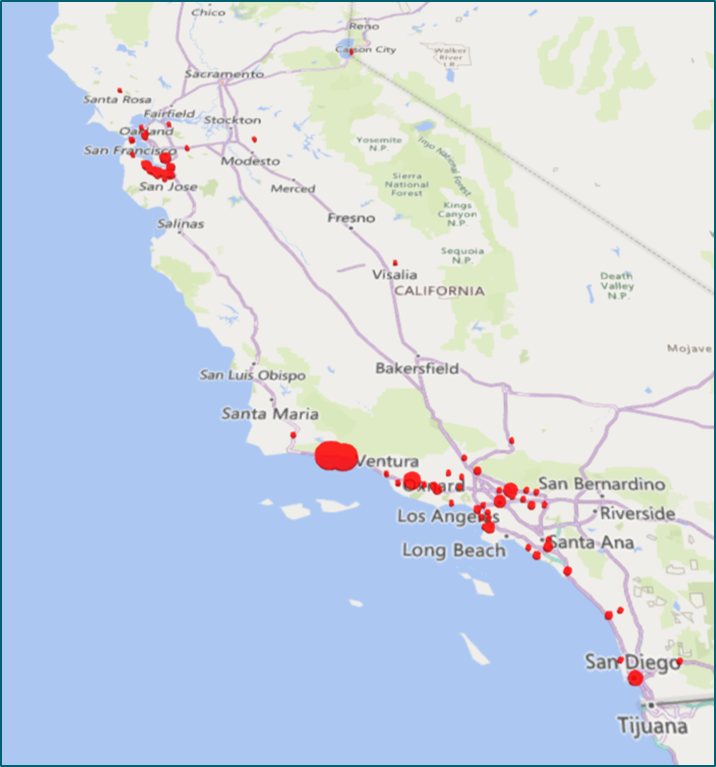
| − | + | The UCSB Nanofabrication Facility serves a wide range of external academic and industrial institutions across the nation. From 2006 through 2020, we have served 92 Academic/Government Institutions (with multiple research groups within some institutions) and 260 Industrial Institutions (195 being small business). This external use is not affiliated with any sponsored UCSB academic research program[[File:US_Usage_Map_2006-2018.png|800x800px|US Map of external institutions served by UCSB Nanotech 2006-2018|none]]The facility has served over 200 total California businesses from 2006 – 2020. 68 are from the SB/Goleta area with 29 of these being formed by faculty and/or former UCSB graduate students and researchers. |
|
| + | [[File:CA Usage Map 2006-2018.png|frameless|502x502px|CA Map of external institutions served by UCSB Nanotech 2006-2018|link=Special:FilePath/CA_Usage_Map_2006-2018.png]] |
||
| ⚫ | |||
| + | |||
| − | * [https://www.nanotech.ucsb.edu/wiki/images/uploads/2018/Nanofabrication%20Facility%20Overview%20for%20Wiki%20-%20%2005-2018%20-%20v2.1%20small.pdf NanoFab Facility Usage Overview Slideshow] - 2018 |
||
| ⚫ | |||
| + | |||
| + | *[[Media:FacilityPresentation.pdf|NanoFab Facility Usage Overview Slideshow - 2021]] |
||
Latest revision as of 17:53, 25 November 2023
Numbers of Annual Users
The UCSB Nanofabrication Facility has seen large user base growth extending from 1998 to the present. A decrease was seen from 2013-2015 which was primarily a result of reduced academic government funding stemming from sequestration. Since 2015, growth in both academic and industrial sectors has been observed with 2019 reaching the highest levels to date. Covid-19 deeply affected the 2020 use, but has since rebounded. The facility serves a broad range of disciplines with Optics, Electronics, Materials, MEMs, and Physics all being over 12% of use. 2018 data is shown as an example and this remains a consistent representation.


External Use of Facility
The UCSB Nanofabrication Facility serves a wide range of external academic and industrial institutions across the nation. From 2006 through 2020, we have served 92 Academic/Government Institutions (with multiple research groups within some institutions) and 260 Industrial Institutions (195 being small business). This external use is not affiliated with any sponsored UCSB academic research program

The facility has served over 200 total California businesses from 2006 – 2020. 68 are from the SB/Goleta area with 29 of these being formed by faculty and/or former UCSB graduate students and researchers.