ASML Stepper 3 - UCSB Test Reticles
Reticle ID: "UCSB-OPC1"
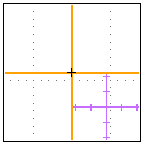
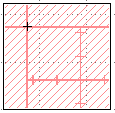
Alignment Markers
Resolution Test Charts
The Resolution test charts are repeated all across the reticle, in order to test for lens aberrations. You can have the system window-off only a single resolution chart, but since they are placed closely together on the reticle, it's very likely that partial shots of adjacent charts will also be exposed.
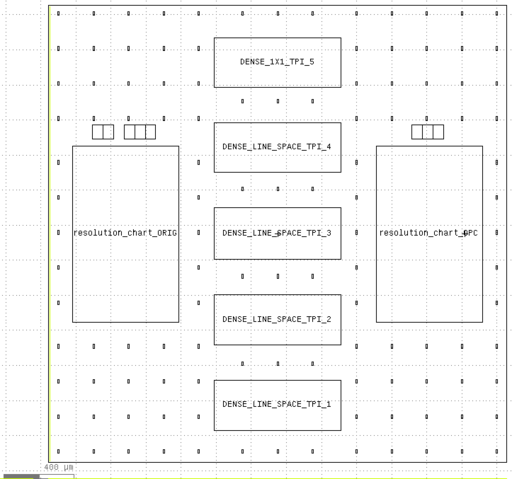
In addition, the repeating cells allow us to test for the proper optical proximity correction algorithm. The Five Dense_... patterns are for calibrating the OPC algorithm, and are not for user analysis.
Calibration Chart Layout
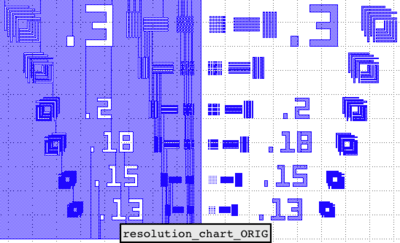
Resolution Chart Schematic
"resolution_chart_ORIG" cell in the above.
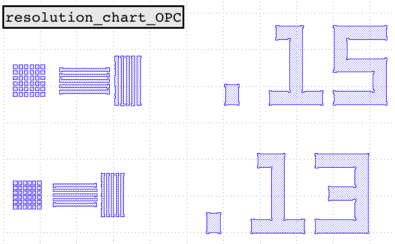
The ""resolution_chart_OPC" version has an optical proximity correction algorithm applied:
Coords for "UCSB_Cal" Resolution Test Patterns
Each of the above cells is repeated on the following coordinates:
| Image Size
X , Y (Wafer, mm) |
Image Shift
X (Wafer, mm) |
Image Shift
Y (Wafer, mm) |
|---|---|---|
| 2.610000 , 2.610000 | -9.450000 | 12.150000 |
| same as above | -6.750000 | 12.150000 |
| -4.050000 | 12.150000 | |
| -1.350000 | 12.150000 | |
| 1.350000 | 12.150000 | |
| 4.050000 | 12.150000 | |
| 6.750000 | 12.150000 | |
| 9.450000 | 12.150000 | |
| -9.450000 | 9.450000 | |
| Alignment Marker | – | – |
| -4.050000 | 9.450000 | |
| -1.350000 | 9.450000 | |
| 1.350000 | 9.450000 | |
| 4.050000 | 9.450000 | |
| Alignment Marker | – | – |
| 9.450000 | 9.450000 | |
| -9.450000 | 6.750000 | |
| -6.750000 | 6.750000 | |
| -4.050000 | 6.750000 | |
| -1.350000 | 6.750000 | |
| 1.350000 | 6.750000 | |
| 4.050000 | 6.750000 | |
| 6.750000 | 6.750000 | |
| 9.450000 | 6.750000 | |
| -9.450000 | 4.050000 | |
| -6.750000 | 4.050000 | |
| -4.050000 | 4.050000 | |
| -1.350000 | 4.050000 | |
| 1.350000 | 4.050000 | |
| 4.050000 | 4.050000 | |
| 6.750000 | 4.050000 | |
| 9.450000 | 4.050000 | |
| -9.450000 | 1.350000 | |
| -6.750000 | 1.350000 | |
| -4.050000 | 1.350000 | |
| -1.350000 | 1.350000 | |
| 1.350000 | 1.350000 | |
| 4.050000 | 1.350000 | |
| 6.750000 | 1.350000 | |
| 9.450000 | 1.350000 | |
| -9.450000 | -1.350000 | |
| -6.750000 | -1.350000 | |
| -4.050000 | -1.350000 | |
| -1.350000 | -1.350000 | |
| 1.350000 | -1.350000 | |
| 4.050000 | -1.350000 | |
| 6.750000 | -1.350000 | |
| 9.450000 | -1.350000 | |
| -9.450000 | -4.050000 | |
| -6.750000 | -4.050000 | |
| -4.050000 | -4.050000 | |
| -1.350000 | -4.050000 | |
| 1.350000 | -4.050000 | |
| 4.050000 | -4.050000 | |
| 6.750000 | -4.050000 | |
| 9.450000 | -4.050000 | |
| -9.450000 | -6.750000 | |
| -6.750000 | -6.750000 | |
| -4.050000 | -6.750000 | |
| -1.350000 | -6.750000 | |
| 1.350000 | -6.750000 | |
| 4.050000 | -6.750000 | |
| 6.750000 | -6.750000 | |
| 9.450000 | -6.750000 | |
| -9.450000 | -9.450000 | |
| Alignment Marker | – | – |
| -4.050000 | -9.450000 | |
| -1.350000 | -9.450000 | |
| 1.350000 | -9.450000 | |
| 4.050000 | -9.450000 | |
| Alignment Marker | – | – |
| 9.450000 | -9.450000 | |
| -9.450000 | -12.150000 | |
| -6.750000 | -12.150000 | |
| -4.050000 | -12.150000 | |
| -1.350000 | -12.150000 | |
| 1.350000 | -12.150000 | |
| 4.050000 | -12.150000 | |
| 6.750000 | -12.150000 | |
| 9.450000 | -12.150000 |

